genoPlotR
Welcome to genoPlotR - plot gene and genome maps project!
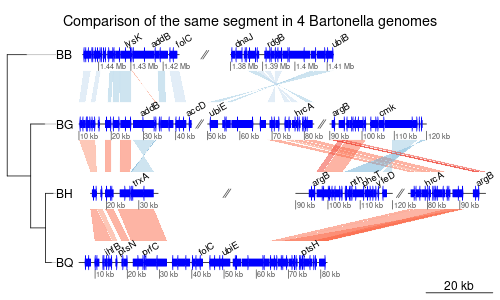
genoPlotR is a R package to produce reproducible, publication-grade graphics of gene and genome maps. It allows the user to read from usual format such as protein table files and blast results, as well as home-made tabular files.
Features
- Linear representation of several segments of DNA
- Comparisons represented by areas between the segments (like Artemis, for example)
- Reads from common formats: Genbank, EMBL, blast, Mauve, and from user-generated tab files
- Plot several subsegments of the same segment on the same line, separated by a //
- Automatic or manual placement of the segments on the plot
- Add annotations to all the lines
- Create smart, automatic annotations for genomes, based on gene names
- Add a user-generated tree
- Add a global scale or a scale to each line
- Use user-defined graphical functions to represent genes
In addition, since the package is developed with grid, it is easy (i) to reproduce exactly the same figure and (ii) to integrate it into larger figures
Authors
Lionel Guy (lionel.guy at imbim.uu.se), Jens Roat Kultima
Citation
Lionel Guy, Jens Roat Kultima, and Siv G. E. Andersson: genoPlotR: comparative gene and genome visualization in R. Bioinformatics 2010;26(18):2334-2335
Link to the article, Download BibTeX citation
Installation
The package is available on CRAN, at http://cran.r-project.org/web/packages/genoPlotR/index.html. It can be installed in a R terminal by typing:
install.packages("genoPlotR")
The project is hosted on R-Forge. The latest development version can be installed directly within R by typing:
install.packages("genoPlotR", repos="http://R-Forge.R-project.org")
The ade4 package is required. It can be installed from CRAN by typing:
install.packages("ade4")
The project summary page contains all info on downloading, obtaining help, reporting bugs and proposing features.
To get started
There are some screenshots available, and a pdf with all the graphics from the examples. A vignette and the manual are also available.
Be sure to check plot_gene_map and the reading functions first.
News:
genoPlotR changes
=================

0.8.11 - 2021-01-05
-------------------
Small fix:
- Replaced calls to order() on data.frames by do.call(order, list=...) to comply
  with the latest R developments.

0.8.10 - 2020-12-10
-------------------
Small fix:
- Removed calls to cairo_pdf(), replaced with standard pdf()

0.8.9 - 2019-01-16
------------------
Fixing colors in the examples: col is now mapping to "col" and not to "fill",
and affects the example data (which has "col").

0.8.8 - 2018-02-21
------------------
Small fix:
- pkg/man/genoPlotR-package.Rd had to be modified not to be unsynched with
  DESCRIPTION

0.8.7 - 2017-11-06
------------------
Small bug fixes:
- Changed CITATION to comply with as.person() requirements
- Corrected a line too long in dna_segs.Rd
- Corrected broken links in the vignette

0.8.6 - 2017-05-15
------------------
Previous version created warnings with R 3.4.0. Removed the inst/doc
folder on R-forge. Package back on CRAN.

0.8.3 - 2015-07-02
------------------
Adapting the package to new CRAN guidelines:
- Imports instead of Depends (imported packages)
- Cleaned up DESCRIPTION, updated email address
- Restored some functions on the webpage

0.8.2 - 2013-12-19
------------------
Adapting the package to new CRAN guidelines:
- Moved vignette from inst/doc/ to vignettes/
- Reduced examples in plot_gene_map to get under 5s checking time

0.8.1 - 2012-11-19
------------------
BUGFIXES:
- Fixed a bug in read_mauve_backbone where the reference genome could be set
  to anything. Added check for that.
- Fixed a bug in apply_color_schemes and the main function, to prevent
  comparisons with 0 rows to crash the program.

0.8 - 2012-06-21
----------------
NEW FEATURE:
- Comparisons that overlap xlims are now included and trimmed inside
  xlims
BUGFIXES:
- Automatic horizontal placement of dna_segs had some error in certain
  conditions
- Reading artemis colors could not be overriden
- Error handling when reading null tables

0.7.1 - 2011-05-04
------------------
NEW FEATURE:
- A scale can be added to the tree (argument tree_scale)
BUGFIX:
- Arguments ylim (of seg_plot objects) were not taken into account
  when plotting

0.7 - 2011-04-18
----------------
NEW FEATURES:
- It is now possible to plot user-defined graphs on top of each dna_seg,
  using the graphical functions of grid or user-defined ones. See
  seg_plot functions and argument in plot_gene_maps
- Added a function, auto_annotate, to create smart annotations from genbank
  or embl files.
- Added the possibility to use user-defined graphical functions to plot
  genes.
- Extra fields (tags) can be parsed from genbank and embl files.
BUGFIX:
- The last line of the features was not read in genbank and embl files

0.6.1 - 2011-03-30
------------------
BUGFIX:
- Vignette contained non-ASCII characters
- Fixed an incoherent variable name in arrow_coord

0.6 - 2011-03-16
------------------
NEW FEATURES:
- Added transparency support in apply_color_scheme, which is applied by
  default.
- Added a function, artemisColors(), that returns the colors as in Artemis.
- read_dna_seg_from_file can now read color or colour tags in genbank or embl
  files.
- Added experimental support for tree branches annotations.
BUGFIX:
- Further corrected a bug occuring when fixed_gap_length was set, and allowing
  comparisons with 0 rows.
- Fasta types were incorrectly guessed
NOTE: some of the features have been released in an intermediate version 0.5.9

0.5.8 - 2011-01-31
------------------
NEW FEATURE:
- The plot area is now clipped, as a workaround to avoid comparisons that
  are too large.
BUGFIX:
- Corrected a bug occuring when fixed_gap_length was set

0.5.7 - 2010-12-16
------------------
BUGFIX:
- Corrected as.dna_seg to prevent factors to slip in and fixed the gene_type
  verification.
NEW FEATURE:
- Changing the color of the dna_labels is possible (not for trees yet)

0.5.6 - 2010-10-04
------------------
BUGFIX:
- Modified the feature parsing algorithm, features with an "_" inside (ex.
  misc_feature) were parsed incorrectly.

0.5.5 - 2010-09-27
------------------
NEW FEATURES:
- Added a new gene_type: lines (and the corresponding side_lines)
- Improved the example for gene_type

0.5.4 - 2010-09-15
------------------
BUGFIX:
- Added some extra checks on mauve input data, and on dna_seg input data
  to avoid mysterious error messages

0.5.3 - 2010-09-08
------------------
Article published in Bioinformatics, added a CITATION file.

0.5.2 - 2010-08-24
------------------
NEW FEATURES:
- Added read_dna_seg_from_fasta, that can read a fasta file and return one
  segment of the corresponding length
- Added two arguments to plot_gene_map, to allow to define the minimum gap
  length and to allow to have fixed gap length but still automating the
  placement of the whole segment.
BUGFIX:
- Corrected a bug that provoked errors in displaying subsegments that were
  closer to each other than the gap length

0.5.1 - 2010-08-19
------------------
BUGFIX:
- Added aliases in the documentation to avoid warnings when compiling

0.5   - 2010-06-14
------------------
NEW FEATURES:
- New argument to plot_gene_map: n_scale_ticks, gives the approx. number of
  ticks in the dna_seg_scales
- New argument to plot_gene_map: scale_cex, allows to change the size
  of the labels in dna_seg_scales
- New argument to plot_gene_map: dna_seg_label_cex, allows to change the
  size of the labels in the tree or dna_seg_labels


0.4.1 - 2010-06-01
------------------
BUGFIX:
- Added support for large phylogenetic trees. Given the mandatory use of
  enum.phylog to permute the trees to fit the labels with the dna_seg labels,
  big trees (requiring more than 1000 permutations) broke the program.
  Now either the tree is permutable, in the right order, or an error is
  thrown.

0.4   - 2010-04-19
------------------
NEW FEATURES:
- Add the multisegment support
- dna_scales, annotations on all the segments,
- Generated new examples.

0.3   - 2010-04-09
------------------
NEW FEATURES:
- On plot_gene_maps, it is now possible to add automatic scale to any or
  all dna_segments.
- It is possible (and recommended) to apply "global" color scheme at the
  time of plotting (and not when parsing comparisons).
INTERNALS:
- Application of color schemes is now more rational
- Named every element and viewport, so its easier to navigate
- Removed dependancies to RColorBrewer

0.2   - 2010-01-11
------------------
Initial commit to R-Forge